Date of Issue:Mar 28, 2024Expiration:Mar 28, 2029Last updated:Aug 22, 2025ENVIRONMENTALPRODUCT DECLARATIONIN ACCORDANCE WITH ISO 14025 AND ISO 21930:2017Carboxane 2000SmartEPD-2024-017-0106-01.1
General InformationCarboline2150 Schuetz Rd, St. Louis, MO 63146 USA1-800-848-4645sustainability@carboline.comcarboline.comProduct Name:Carboxane 2000Functional Unit:1 m2 of covered and protected substrate for 60 yearsDeclaration Number:SmartEPD-2024-017-0106-01.1Date of Issue:March 28, 2024Expiration:March 28, 2029Last updated:August 22, 2025EPD Scope:Cradle to graveA1 - A3, A4, A5, B1 - B7, C1 - C4Market(s) of Applicability:North AmericaGeneral Organization InformationFor over seven decades, Carboline has been at the forefront of delivering cutting-edge product development alongside a wealth of technical expertise andexperience, offering unparalleled protective coating solutions on a global scale. As a notable manufacturer of paint and coating products, Carboline isdedicated to showcasing its sustainability leadership while recognizing the business value in transparently reporting the comprehensive environmentalimpacts of its products, spanning from cradle to grave. For further details on Carboline's product range, visit their website at https://www.carboline.com/.Further information can be found at:https://www.carboline.comLimitations, Liability and OwnershipIn order to support comparative assertions, this EPD meets all comparability requirements stated in ISO 14025:2006. However, differences in certainassumptions, data quality, and variability between LCA data sets may still exist. As such, caution should be exercised when evaluating EPDs from differentmanufacturers or programs, as the EPD results may not be entirely comparable. Any EPD comparison must be carried out at the construction works level perISO 21930:2017 guidelines. The results of this EPD reflect an average performance by the product and its actual impacts may vary on a case-to-case basis.The EPD owner shall have sole ownership, liability, and responsibility for the EPD.Reference StandardsStandard(s):ISO 14025 and ISO 21930:2017Core PCR:PCR for Architectural CoatingsDate of issue: June 18, 2015Valid until: June 30, 2024Sub-category PCR review panel:Contact Smart EPD for more information.Carboxane 2000CarbolinePage 2 / 18
General Program Instructions:Smart EPD General Program Instructions v.1.0, November 2022Verification InformationLCA Author/Creator:Alex DuvallParqsolutions@parqhq.comEPD Program Operator:Smart EPDinfo@smartepd.comwww.smartepd.com585 Grove St., Ste. 145, Herndon, VA 20170, USAVerification:Independent critical review of the LCA and data, according to ISO 14044 andISO 14071:ExternalAnna LassoSmart EPDanna.lasso@smartepd.comIndependent external verification of EPD, according to ISO 14025 andreference PCR(s):ExternalAnna LassoSmart EPDanna.lasso@smartepd.comProduct InformationFunctional Unit:1 m2 of covered and protected substrate for 60 yearsMass:1.31 kgReference Service Life:10 YearsProduct Specificity:Product AverageProduct SpecificProduct DescriptionCarboxane 2000 is an isocyanate free, ultra-durable coating that provides outstanding color and gloss retention as well as excellent corrosion protection forexterior exposures. When used over a suitable primer (as a two coat system) Carboxane 2000 provides the barrier, corrosion resistance properties, andweatherability normally achieved with a three-coat system (primer, epoxy intermediate with an acrylic-polyurethane finish) for most environments. Thissignificantly speeds up the painting process, saves labor, and saves money without sacrificing performance. This tightly cross-linked film utilizes a UV-resistant siloxane binder resulting in a finish with excellent corrosion protection and weathering performance that far exceeds aliphatic polyurethanes.Further information can be found at:https://www.carboline.com/products/product-details/Carboxane-2000Product SpecificationsProduct SKU(s):2000WITE9SDD, 2000WITEAT4D, 20000908BHSDProduct Classification Codes:Masterformat - 09 96 00EC3 - Finishes -> PaintingAndCoatingArchitectural Coating Subcategory:Exterior Architectural CoatingCarboxane 2000CarbolinePage 3 / 18
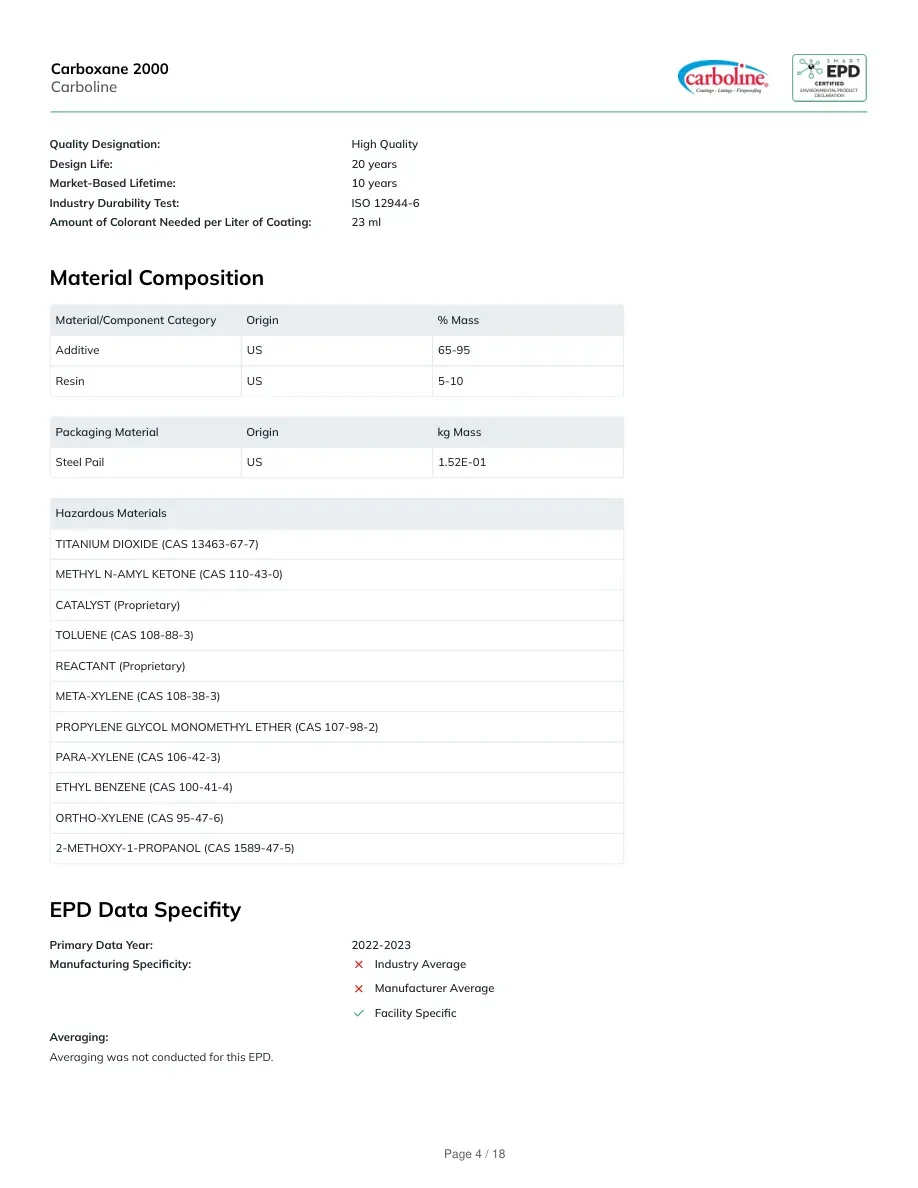
Quality Designation:High QualityDesign Life:20 yearsMarket-Based Lifetime:10 yearsIndustry Durability Test:ISO 12944-6Amount of Colorant Needed per Liter of Coating:23 mlMaterial CompositionMaterial/Component CategoryOrigin% MassAdditiveUS65-95ResinUS5-10Packaging MaterialOriginkg MassSteel PailUS1.52E-01Hazardous MaterialsTITANIUM DIOXIDE (CAS 13463-67-7)METHYL N-AMYL KETONE (CAS 110-43-0)CATALYST (Proprietary)TOLUENE (CAS 108-88-3)REACTANT (Proprietary)META-XYLENE (CAS 108-38-3)PROPYLENE GLYCOL MONOMETHYL ETHER (CAS 107-98-2)PARA-XYLENE (CAS 106-42-3)ETHYL BENZENE (CAS 100-41-4)ORTHO-XYLENE (CAS 95-47-6)2-METHOXY-1-PROPANOL (CAS 1589-47-5)EPD Data SpecifityPrimary Data Year:2022-2023Manufacturing Specificity:Industry AverageManufacturer AverageFacility SpecificAveraging:Averaging was not conducted for this EPD.Carboxane 2000CarbolinePage 4 / 18
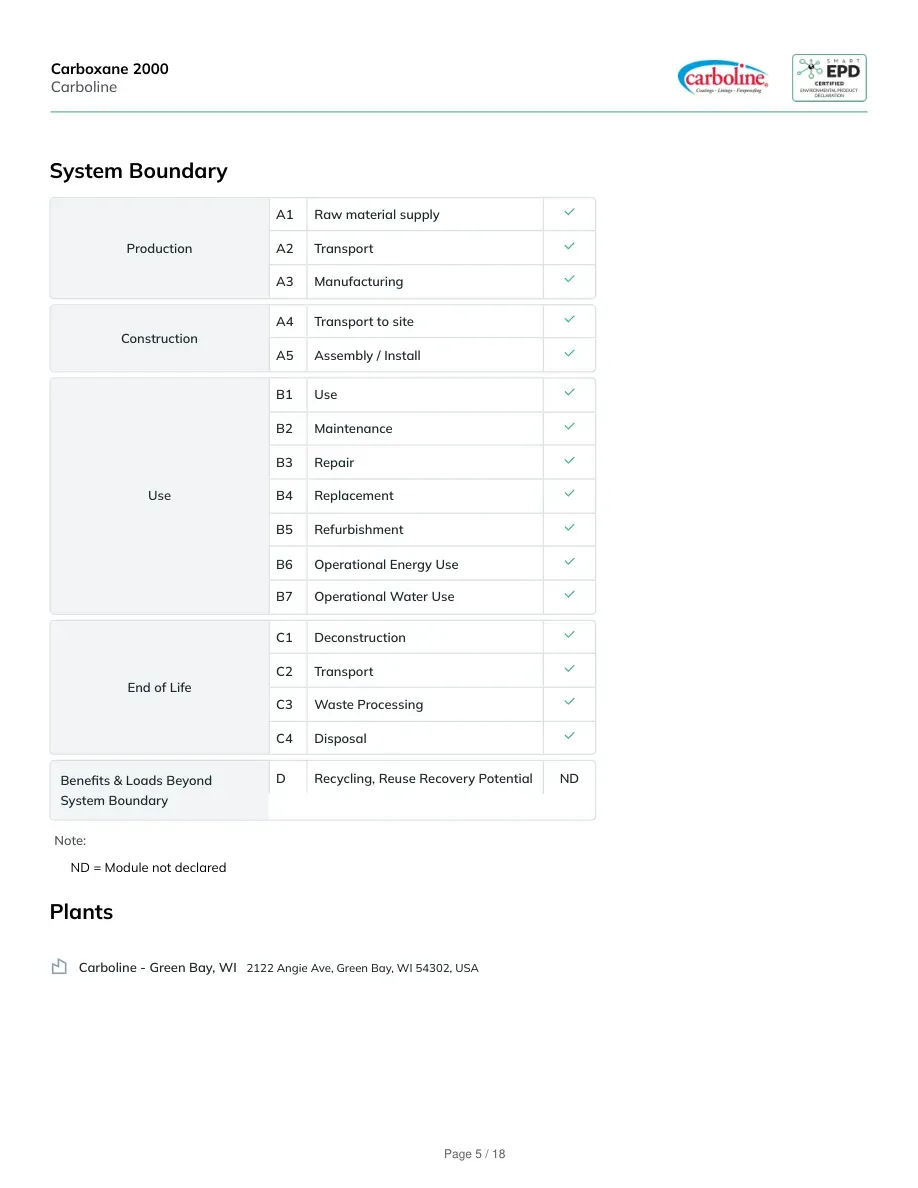
System BoundaryProductionA1Raw material supplyA2TransportA3ManufacturingConstructionA4Transport to siteA5Assembly / InstallUseB1UseB2MaintenanceB3RepairB4ReplacementB5RefurbishmentB6Operational Energy UseB7Operational Water UseEnd of LifeC1DeconstructionC2TransportC3Waste ProcessingC4DisposalBenefits & Loads BeyondSystem BoundaryDRecycling, Reuse Recovery PotentialNDNote:ND = Module not declaredPlantsCarboline - Green Bay, WI2122 Angie Ave, Green Bay, WI 54302, USACarboxane 2000CarbolinePage 5 / 18
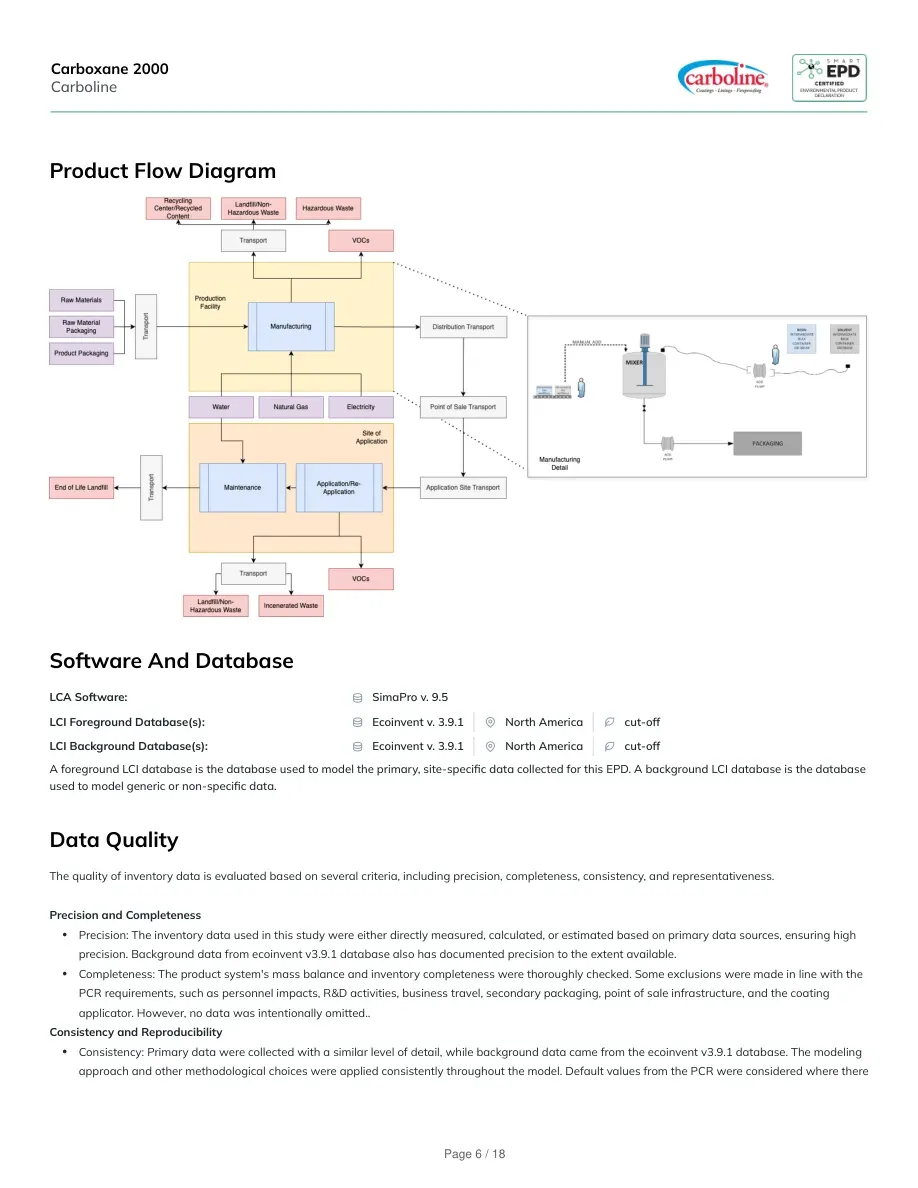
Product Flow DiagramSoftware And DatabaseLCA Software:SimaPro v. 9.5LCI Foreground Database(s):Ecoinvent v. 3.9.1North Americacut-offLCI Background Database(s):Ecoinvent v. 3.9.1North Americacut-offA foreground LCI database is the database used to model the primary, site-specific data collected for this EPD. A background LCI database is the databaseused to model generic or non-specific data.Data QualityThe quality of inventory data is evaluated based on several criteria, including precision, completeness, consistency, and representativeness.Precision and CompletenessPrecision: The inventory data used in this study were either directly measured, calculated, or estimated based on primary data sources, ensuring highprecision. Background data from ecoinvent v3.9.1 database also has documented precision to the extent available.Completeness: The product system's mass balance and inventory completeness were thoroughly checked. Some exclusions were made in line with thePCR requirements, such as personnel impacts, R&D activities, business travel, secondary packaging, point of sale infrastructure, and the coatingapplicator. However, no data was intentionally omitted..Consistency and ReproducibilityConsistency: Primary data were collected with a similar level of detail, while background data came from the ecoinvent v3.9.1 database. The modelingapproach and other methodological choices were applied consistently throughout the model. Default values from the PCR were considered where thereCarboxane 2000CarbolinePage 6 / 18
was unavailability of primary data, For example, the default waste transport distance was used for product disposal assessment.Reproducibility: This study ensures reproducibility by providing comprehensive disclosure of input-output data, dataset choices, and modelingapproaches. A knowledgeable third party should be able to approximate the results using the same data and modeling methods.RepresentativenessTemporal: Primary data were collected for the one-year period of October 2022 to September 2023 to ensure the representativeness of post-consumercontent. Secondary data from the ecoinvent v3.9.1 database is typically representative of recent years.Geographical: Primary data represent Carboline's production facilities in Green Bay (Wisconsin), Dayton (Nevada) and Lake Charles (Louisiana). Whereapplicable, differences in electric grid mix were considered using appropriate secondary data. The use of country-specific data ensures highgeographical representativeness, and proxy data were only used when country-specific data were unavailable.Technological: Both primary and secondary data were tailored to the specific technologies studied, ensuring high technological representativeness.Where no direct raw material information was available in the ecoinvent 3.9 database, proxies were identified and used.Life Cycle Module DescriptionThe manufacturing of this product involves the direct procurement of raw materials from suppliers in module A1. In module A2, the raw material suppliers transport the materials, along with the associated packaging, to Carboline's manufacturing facility in Green Bay, WI, where they are stored and mixed to produce the coatings in module A3. Mixing and blending of raw materials occur using manual and air-operated diaphragm pumps in the mixer. The end result is the mixed product. For the products manufactured at the Green Bay facility, scrap, packaging waste and non-hazardous waste are assumed to be shipped to the Brown County South Landfill, Greenleaf, located 32 kilometers away from Carboline's Green Bay plant. Hazardous waste is assumed to be sent to Brown County Resource Recovery (10 km away). The coating is distributed and sold across North America in module A4. Use of the product consists of daily maintenance cleaning with a mop and a cleaning solution such as Hillyard SM-1® Industrial Cleaner Degreaser in module B2. Necessary recoats (re-applications) of the product to achieve service life are modeled in module B4 per the PCR. The plastic or steel can packaging is discarded to landfill and a 2% coating loss rate during application is assumed per the PCR (for both initial application and any recoats). End of life impacts include transport to disposal and final waste processing in modules C2 and C3, respectively, and landfilling of the substrate with applied coating in module C4, per the PCR.LCA DiscussionAllocation ProcedureProduct packaging was allocated by mass. Manufacturing inputs requiring allocation were electricity and natural gas as the production of multiple productsis measured using a single meter for each. The allocation of each was based on the percentage of production for the product in question divided by the totalsite production output.Cut-off ProcedureThe model includes over 95% of the total material mass, energy and environmental relevance throughout the product lifetime. Cut-off rules do not apply forhazardous or toxic materials, and the materials were included in the study.Renewable ElectricityEnergy Attribute Certificates (EACs) such asRenewable Energy Certificates (RECs) or PowerNoCarboxane 2000CarbolinePage 7 / 18
Purchase Agreements (PPAs) are included in thebaseline reported results:ScenariosTransport to the building/construction site (A4)A4 ModuleFuel Type:DieselVehicle Type:Truck and TrailerTransport Distance:1276 kmCapacity Utilization:33 %Packaging Mass:0.152 kgGross density of products transported:1290 kg/m3Weight of products transported:1.31 kgVolume of products transported:0.001 m3Capacity utilization volume factor:1Assumptions for scenario development:Transport distance includes finished product to distribution center and distribution center to pointof sale. Passenger van assumed for point of sale to application site, with a distance of 8km usingsame packaging and capacity assumptions.Installation in to the building/construction site (A5)A5 ModuleProduct Lost per Declared/Functional Unit:0.131 kgMass of Packaging Waste Specified by Type:0.152 kgVOC Emissions:216000000000 ug/m3Assumptions for scenario development:The VOC content reported in this EPD is an estimated value and may not accurately representthe actual VOC emissions during the coating's curing process after installation. It is provided forinformational purposes only and should not be used as a direct indicator of emissions underactual use conditions.VOC Test Method:ASTM D-2369Use (B1)B1 ModuleDeclared Product Properties:Designed to provide excellent corrosion protection for exterior exposures. It also provides the barrier, corrosion resistance properties, and weatherability. Itis isocyanate free and is VOC compliant with excellent durability. This product is is available as two component system.Design Application Parameters:Spraying or brush-rolling as the preferred method of application. Substrate temperature for metal must be between 35°F and 110°F. Relative humiditymust not exceed 90%. Substrate temperature must be 5°F above the Dew Point. This product requires separate onsite power mixing of two componentsand then their combination with power mixing. Cure cycle is temperature-dependent. Curing under low humidity conditions will extend times. Consultproduct technical data sheet for detailed application parameters. Consult a Carboline representative.An Assumed Quality of Work, When Installed in Accordance with The Manufacturer’s Instructions:Long term protection is achieved when installed in accordance with manufacturer's instructions. Theoretical coverage is 1203 ft2/gal at 3-7 mils.Carboxane 2000CarbolinePage 8 / 18
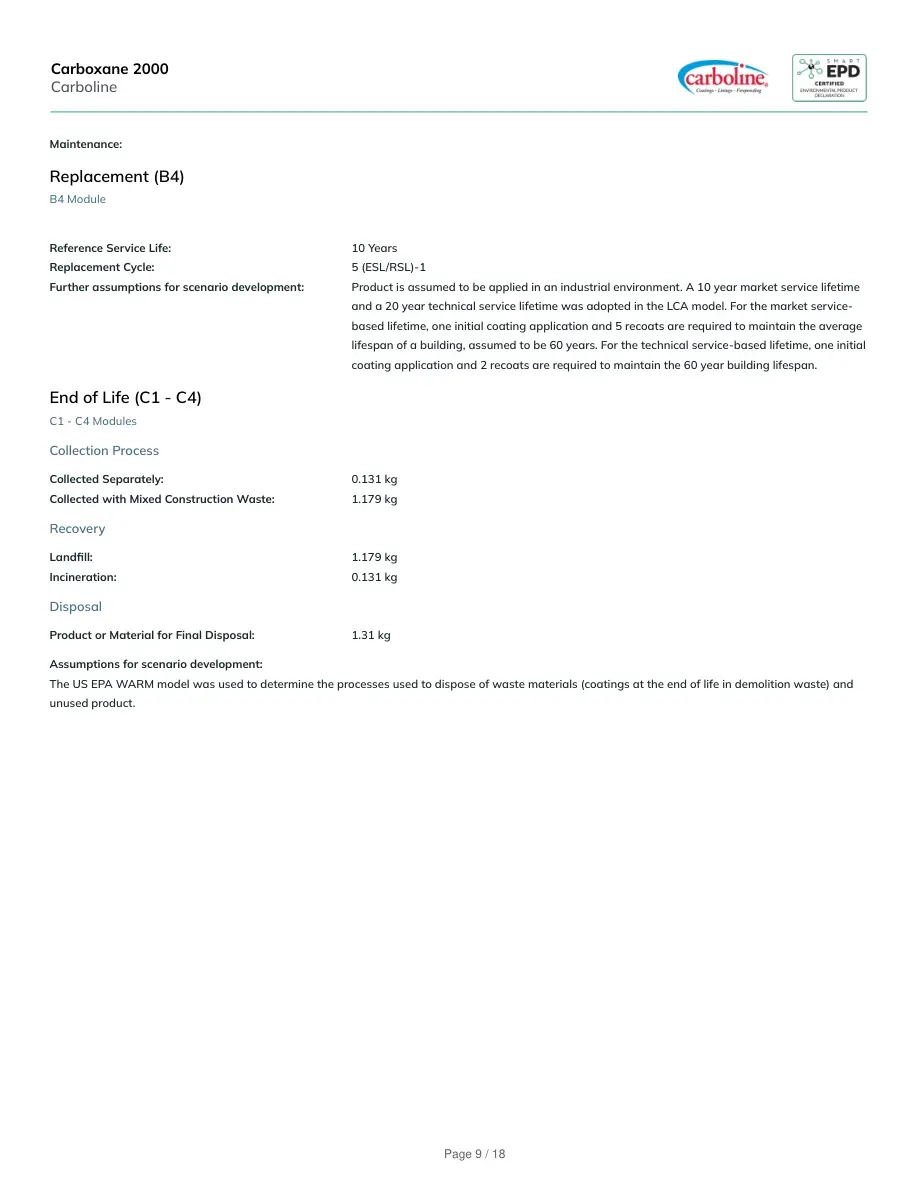
Maintenance:Replacement (B4)B4 ModuleReference Service Life:10 YearsReplacement Cycle:5 (ESL/RSL)-1Further assumptions for scenario development:Product is assumed to be applied in an industrial environment. A 10 year market service lifetimeand a 20 year technical service lifetime was adopted in the LCA model. For the market service-based lifetime, one initial coating application and 5 recoats are required to maintain the averagelifespan of a building, assumed to be 60 years. For the technical service-based lifetime, one initialcoating application and 2 recoats are required to maintain the 60 year building lifespan.End of Life (C1 - C4)C1 - C4 ModulesCollection ProcessCollected Separately:0.131 kgCollected with Mixed Construction Waste:1.179 kgRecoveryLandfill:1.179 kgIncineration:0.131 kgDisposalProduct or Material for Final Disposal:1.31 kgAssumptions for scenario development:The US EPA WARM model was used to determine the processes used to dispose of waste materials (coatings at the end of life in demolition waste) andunused product.Carboxane 2000CarbolinePage 9 / 18
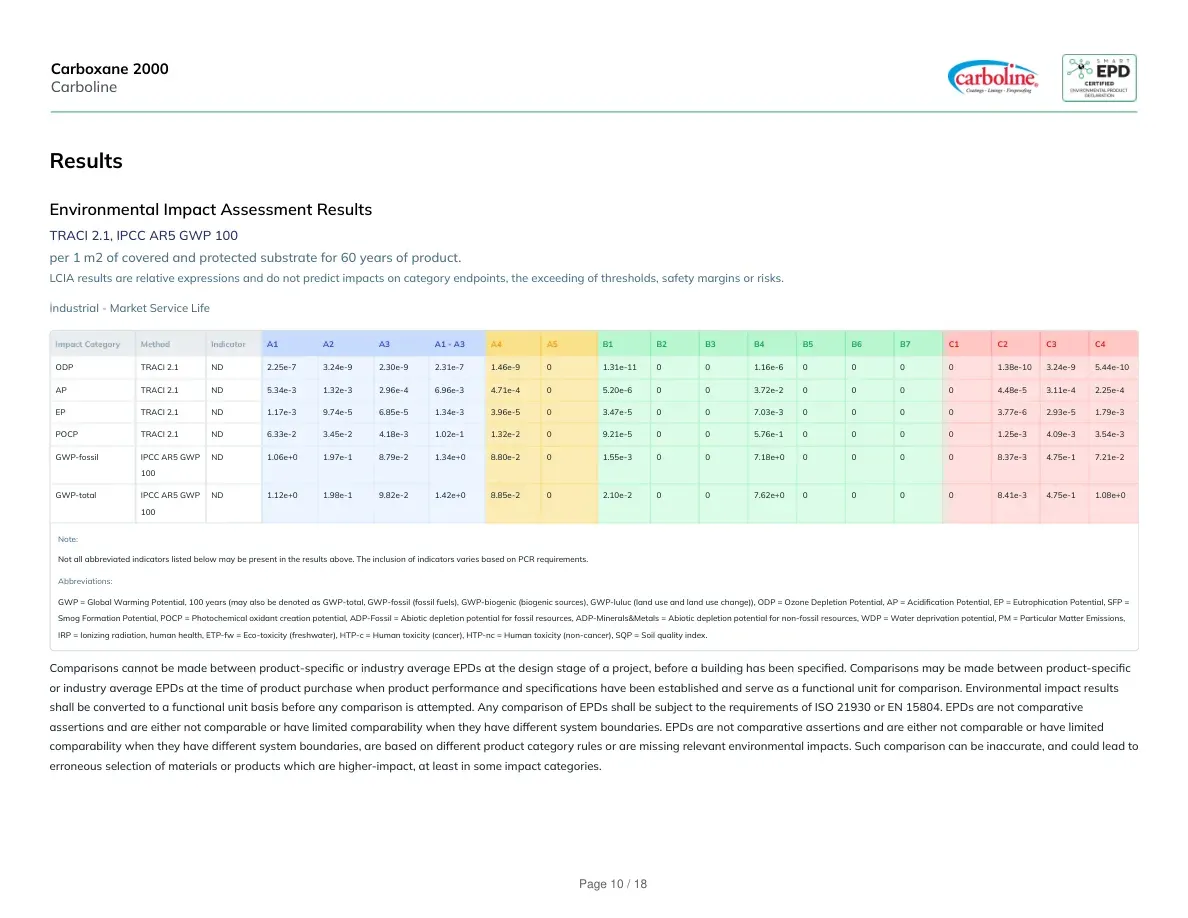
ResultsEnvironmental Impact Assessment ResultsTRACI 2.1, IPCC AR5 GWP 100per 1 m2 of covered and protected substrate for 60 years of product.LCIA results are relative expressions and do not predict impacts on category endpoints, the exceeding of thresholds, safety margins or risks.Industrial - Market Service LifeImpact CategoryMethodIndicatorA1A2A3A1 - A3A4A5B1B2B3B4B5B6B7C1C2C3C4ODPTRACI 2.1ND2.25e-73.24e-92.30e-92.31e-71.46e-901.31e-11001.16e-600001.38e-103.24e-95.44e-10APTRACI 2.1ND5.34e-31.32e-32.96e-46.96e-34.71e-405.20e-6003.72e-200004.48e-53.11e-42.25e-4EPTRACI 2.1ND1.17e-39.74e-56.85e-51.34e-33.96e-503.47e-5007.03e-300003.77e-62.93e-51.79e-3POCPTRACI 2.1ND6.33e-23.45e-24.18e-31.02e-11.32e-209.21e-5005.76e-100001.25e-34.09e-33.54e-3GWP-fossilIPCC AR5 GWP100ND1.06e+01.97e-18.79e-21.34e+08.80e-201.55e-3007.18e+000008.37e-34.75e-17.21e-2GWP-totalIPCC AR5 GWP100ND1.12e+01.98e-19.82e-21.42e+08.85e-202.10e-2007.62e+000008.41e-34.75e-11.08e+0Note:Not all abbreviated indicators listed below may be present in the results above. The inclusion of indicators varies based on PCR requirements.Abbreviations:GWP = Global Warming Potential, 100 years (may also be denoted as GWP-total, GWP-fossil (fossil fuels), GWP-biogenic (biogenic sources), GWP-luluc (land use and land use change)), ODP = Ozone Depletion Potential, AP = Acidification Potential, EP = Eutrophication Potential, SFP =Smog Formation Potential, POCP = Photochemical oxidant creation potential, ADP-Fossil = Abiotic depletion potential for fossil resources, ADP-Minerals&Metals = Abiotic depletion potential for non-fossil resources, WDP = Water deprivation potential, PM = Particular Matter Emissions,IRP = Ionizing radiation, human health, ETP-fw = Eco-toxicity (freshwater), HTP-c = Human toxicity (cancer), HTP-nc = Human toxicity (non-cancer), SQP = Soil quality index.Comparisons cannot be made between product-specific or industry average EPDs at the design stage of a project, before a building has been specified. Comparisons may be made between product-specificor industry average EPDs at the time of product purchase when product performance and specifications have been established and serve as a functional unit for comparison. Environmental impact resultsshall be converted to a functional unit basis before any comparison is attempted. Any comparison of EPDs shall be subject to the requirements of ISO 21930 or EN 15804. EPDs are not comparativeassertions and are either not comparable or have limited comparability when they have different system boundaries. EPDs are not comparative assertions and are either not comparable or have limitedcomparability when they have different system boundaries, are based on different product category rules or are missing relevant environmental impacts. Such comparison can be inaccurate, and could lead toerroneous selection of materials or products which are higher-impact, at least in some impact categories.Carboxane 2000CarbolinePage 10 / 18
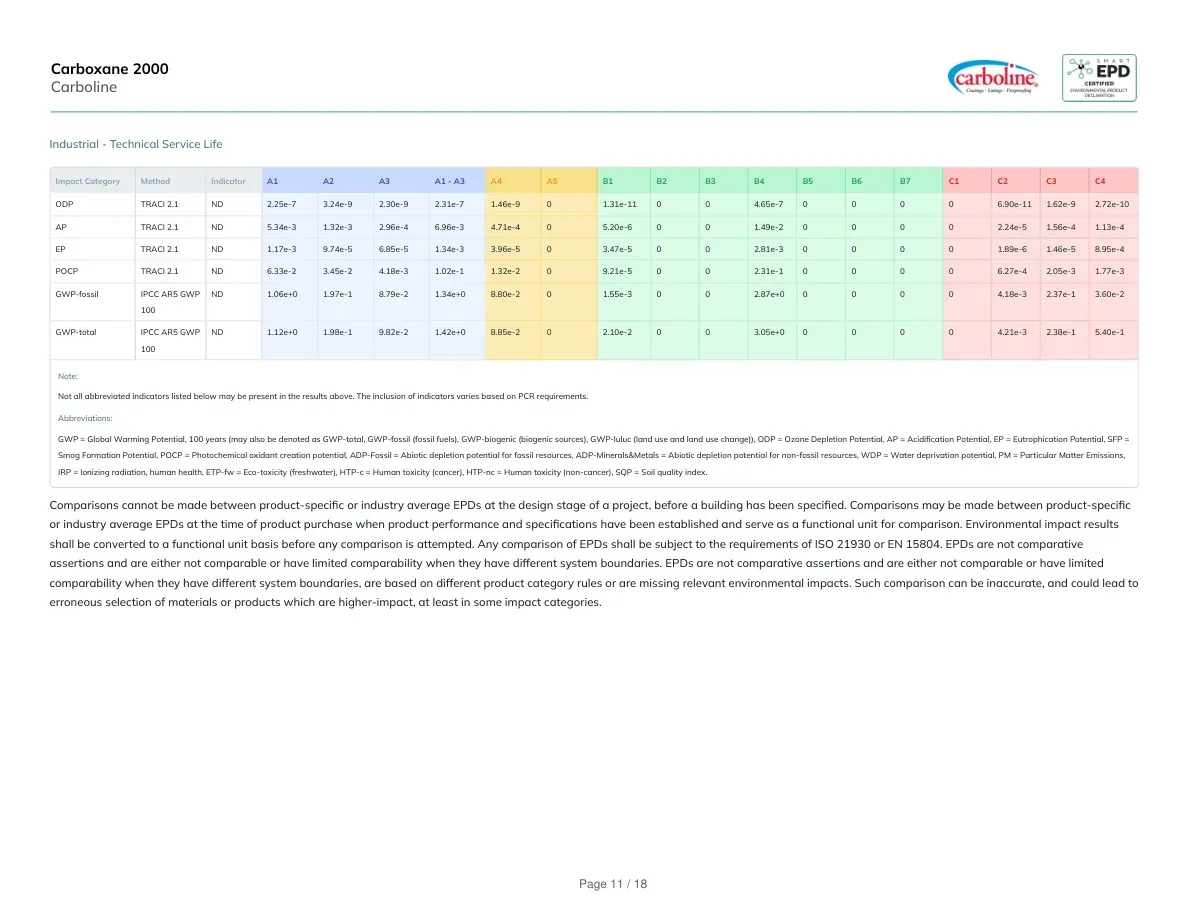
Industrial - Technical Service LifeImpact CategoryMethodIndicatorA1A2A3A1 - A3A4A5B1B2B3B4B5B6B7C1C2C3C4ODPTRACI 2.1ND2.25e-73.24e-92.30e-92.31e-71.46e-901.31e-11004.65e-700006.90e-111.62e-92.72e-10APTRACI 2.1ND5.34e-31.32e-32.96e-46.96e-34.71e-405.20e-6001.49e-200002.24e-51.56e-41.13e-4EPTRACI 2.1ND1.17e-39.74e-56.85e-51.34e-33.96e-503.47e-5002.81e-300001.89e-61.46e-58.95e-4POCPTRACI 2.1ND6.33e-23.45e-24.18e-31.02e-11.32e-209.21e-5002.31e-100006.27e-42.05e-31.77e-3GWP-fossilIPCC AR5 GWP100ND1.06e+01.97e-18.79e-21.34e+08.80e-201.55e-3002.87e+000004.18e-32.37e-13.60e-2GWP-totalIPCC AR5 GWP100ND1.12e+01.98e-19.82e-21.42e+08.85e-202.10e-2003.05e+000004.21e-32.38e-15.40e-1Note:Not all abbreviated indicators listed below may be present in the results above. The inclusion of indicators varies based on PCR requirements.Abbreviations:GWP = Global Warming Potential, 100 years (may also be denoted as GWP-total, GWP-fossil (fossil fuels), GWP-biogenic (biogenic sources), GWP-luluc (land use and land use change)), ODP = Ozone Depletion Potential, AP = Acidification Potential, EP = Eutrophication Potential, SFP =Smog Formation Potential, POCP = Photochemical oxidant creation potential, ADP-Fossil = Abiotic depletion potential for fossil resources, ADP-Minerals&Metals = Abiotic depletion potential for non-fossil resources, WDP = Water deprivation potential, PM = Particular Matter Emissions,IRP = Ionizing radiation, human health, ETP-fw = Eco-toxicity (freshwater), HTP-c = Human toxicity (cancer), HTP-nc = Human toxicity (non-cancer), SQP = Soil quality index.Comparisons cannot be made between product-specific or industry average EPDs at the design stage of a project, before a building has been specified. Comparisons may be made between product-specificor industry average EPDs at the time of product purchase when product performance and specifications have been established and serve as a functional unit for comparison. Environmental impact resultsshall be converted to a functional unit basis before any comparison is attempted. Any comparison of EPDs shall be subject to the requirements of ISO 21930 or EN 15804. EPDs are not comparativeassertions and are either not comparable or have limited comparability when they have different system boundaries. EPDs are not comparative assertions and are either not comparable or have limitedcomparability when they have different system boundaries, are based on different product category rules or are missing relevant environmental impacts. Such comparison can be inaccurate, and could lead toerroneous selection of materials or products which are higher-impact, at least in some impact categories.Carboxane 2000CarbolinePage 11 / 18
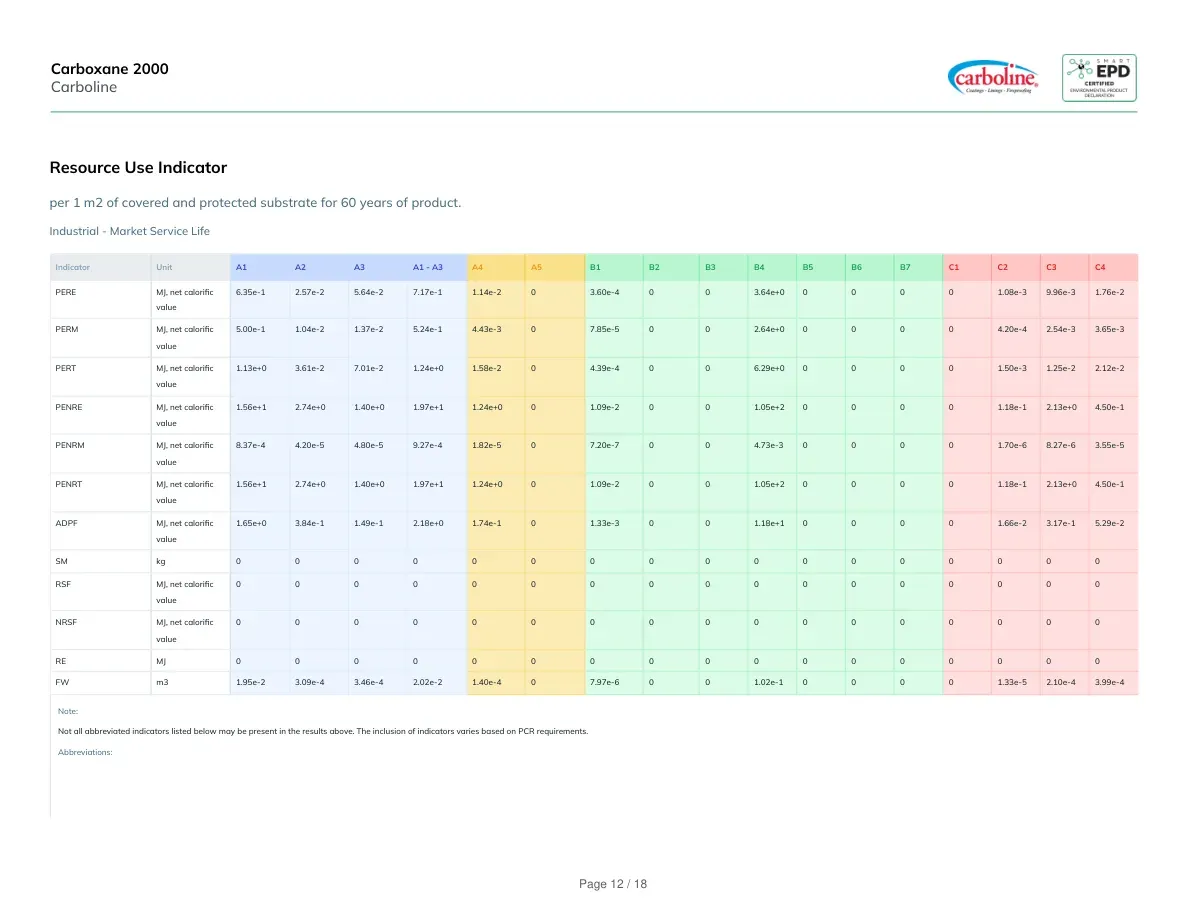
Resource Use Indicatorper 1 m2 of covered and protected substrate for 60 years of product.Industrial - Market Service LifeIndicatorUnitA1A2A3A1 - A3A4A5B1B2B3B4B5B6B7C1C2C3C4PEREMJ, net calorificvalue6.35e-12.57e-25.64e-27.17e-11.14e-203.60e-4003.64e+000001.08e-39.96e-31.76e-2PERMMJ, net calorificvalue5.00e-11.04e-21.37e-25.24e-14.43e-307.85e-5002.64e+000004.20e-42.54e-33.65e-3PERTMJ, net calorificvalue1.13e+03.61e-27.01e-21.24e+01.58e-204.39e-4006.29e+000001.50e-31.25e-22.12e-2PENREMJ, net calorificvalue1.56e+12.74e+01.40e+01.97e+11.24e+001.09e-2001.05e+200001.18e-12.13e+04.50e-1PENRMMJ, net calorificvalue8.37e-44.20e-54.80e-59.27e-41.82e-507.20e-7004.73e-300001.70e-68.27e-63.55e-5PENRTMJ, net calorificvalue1.56e+12.74e+01.40e+01.97e+11.24e+001.09e-2001.05e+200001.18e-12.13e+04.50e-1ADPFMJ, net calorificvalue1.65e+03.84e-11.49e-12.18e+01.74e-101.33e-3001.18e+100001.66e-23.17e-15.29e-2SMkg00000000000000000RSFMJ, net calorificvalue00000000000000000NRSFMJ, net calorificvalue00000000000000000REMJ00000000000000000FWm31.95e-23.09e-43.46e-42.02e-21.40e-407.97e-6001.02e-100001.33e-52.10e-43.99e-4Note:Not all abbreviated indicators listed below may be present in the results above. The inclusion of indicators varies based on PCR requirements.Abbreviations:Carboxane 2000CarbolinePage 12 / 18
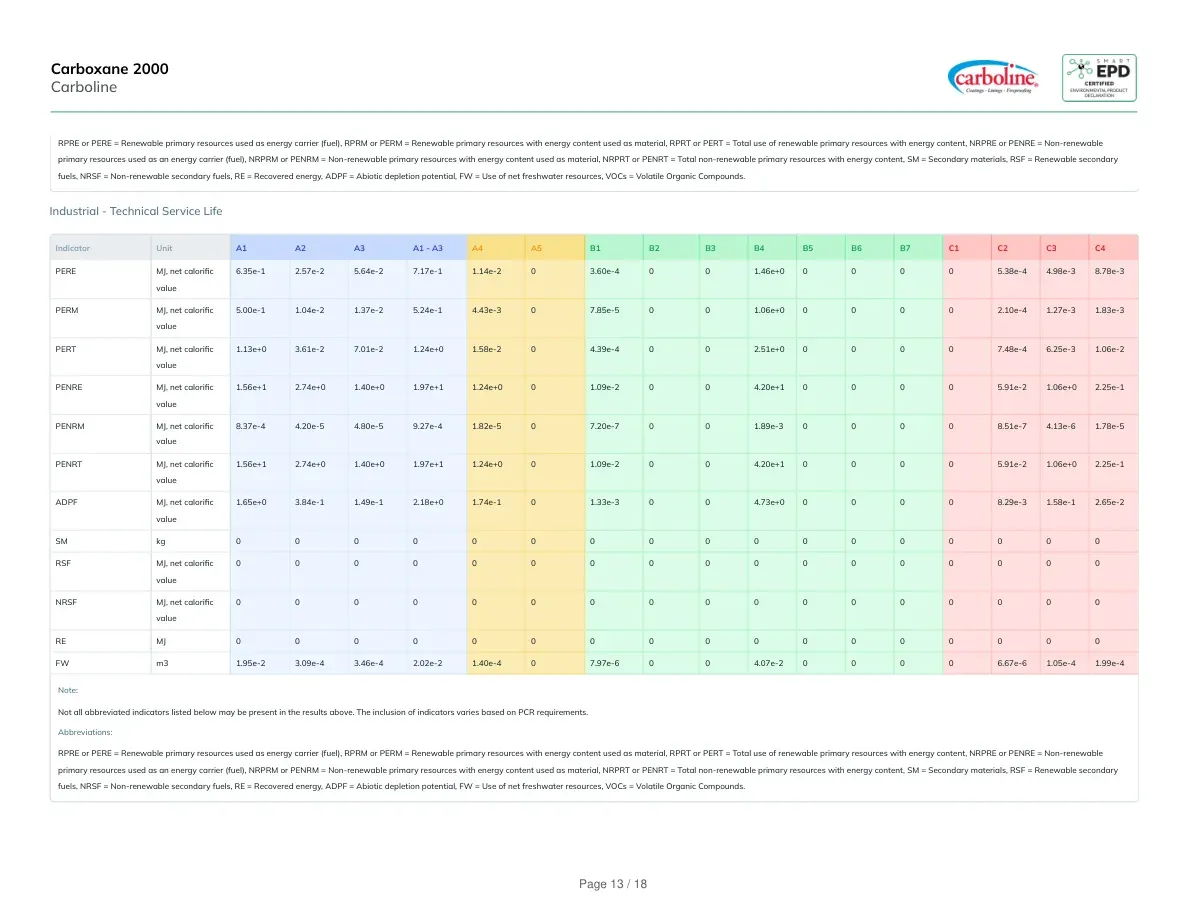
RPRE or PERE = Renewable primary resources used as energy carrier (fuel), RPRM or PERM = Renewable primary resources with energy content used as material, RPRT or PERT = Total use of renewable primary resources with energy content, NRPRE or PENRE = Non-renewableprimary resources used as an energy carrier (fuel), NRPRM or PENRM = Non-renewable primary resources with energy content used as material, NRPRT or PENRT = Total non-renewable primary resources with energy content, SM = Secondary materials, RSF = Renewable secondaryfuels, NRSF = Non-renewable secondary fuels, RE = Recovered energy, ADPF = Abiotic depletion potential, FW = Use of net freshwater resources, VOCs = Volatile Organic Compounds.Industrial - Technical Service LifeIndicatorUnitA1A2A3A1 - A3A4A5B1B2B3B4B5B6B7C1C2C3C4PEREMJ, net calorificvalue6.35e-12.57e-25.64e-27.17e-11.14e-203.60e-4001.46e+000005.38e-44.98e-38.78e-3PERMMJ, net calorificvalue5.00e-11.04e-21.37e-25.24e-14.43e-307.85e-5001.06e+000002.10e-41.27e-31.83e-3PERTMJ, net calorificvalue1.13e+03.61e-27.01e-21.24e+01.58e-204.39e-4002.51e+000007.48e-46.25e-31.06e-2PENREMJ, net calorificvalue1.56e+12.74e+01.40e+01.97e+11.24e+001.09e-2004.20e+100005.91e-21.06e+02.25e-1PENRMMJ, net calorificvalue8.37e-44.20e-54.80e-59.27e-41.82e-507.20e-7001.89e-300008.51e-74.13e-61.78e-5PENRTMJ, net calorificvalue1.56e+12.74e+01.40e+01.97e+11.24e+001.09e-2004.20e+100005.91e-21.06e+02.25e-1ADPFMJ, net calorificvalue1.65e+03.84e-11.49e-12.18e+01.74e-101.33e-3004.73e+000008.29e-31.58e-12.65e-2SMkg00000000000000000RSFMJ, net calorificvalue00000000000000000NRSFMJ, net calorificvalue00000000000000000REMJ00000000000000000FWm31.95e-23.09e-43.46e-42.02e-21.40e-407.97e-6004.07e-200006.67e-61.05e-41.99e-4Note:Not all abbreviated indicators listed below may be present in the results above. The inclusion of indicators varies based on PCR requirements.Abbreviations:RPRE or PERE = Renewable primary resources used as energy carrier (fuel), RPRM or PERM = Renewable primary resources with energy content used as material, RPRT or PERT = Total use of renewable primary resources with energy content, NRPRE or PENRE = Non-renewableprimary resources used as an energy carrier (fuel), NRPRM or PENRM = Non-renewable primary resources with energy content used as material, NRPRT or PENRT = Total non-renewable primary resources with energy content, SM = Secondary materials, RSF = Renewable secondaryfuels, NRSF = Non-renewable secondary fuels, RE = Recovered energy, ADPF = Abiotic depletion potential, FW = Use of net freshwater resources, VOCs = Volatile Organic Compounds.Carboxane 2000CarbolinePage 13 / 18
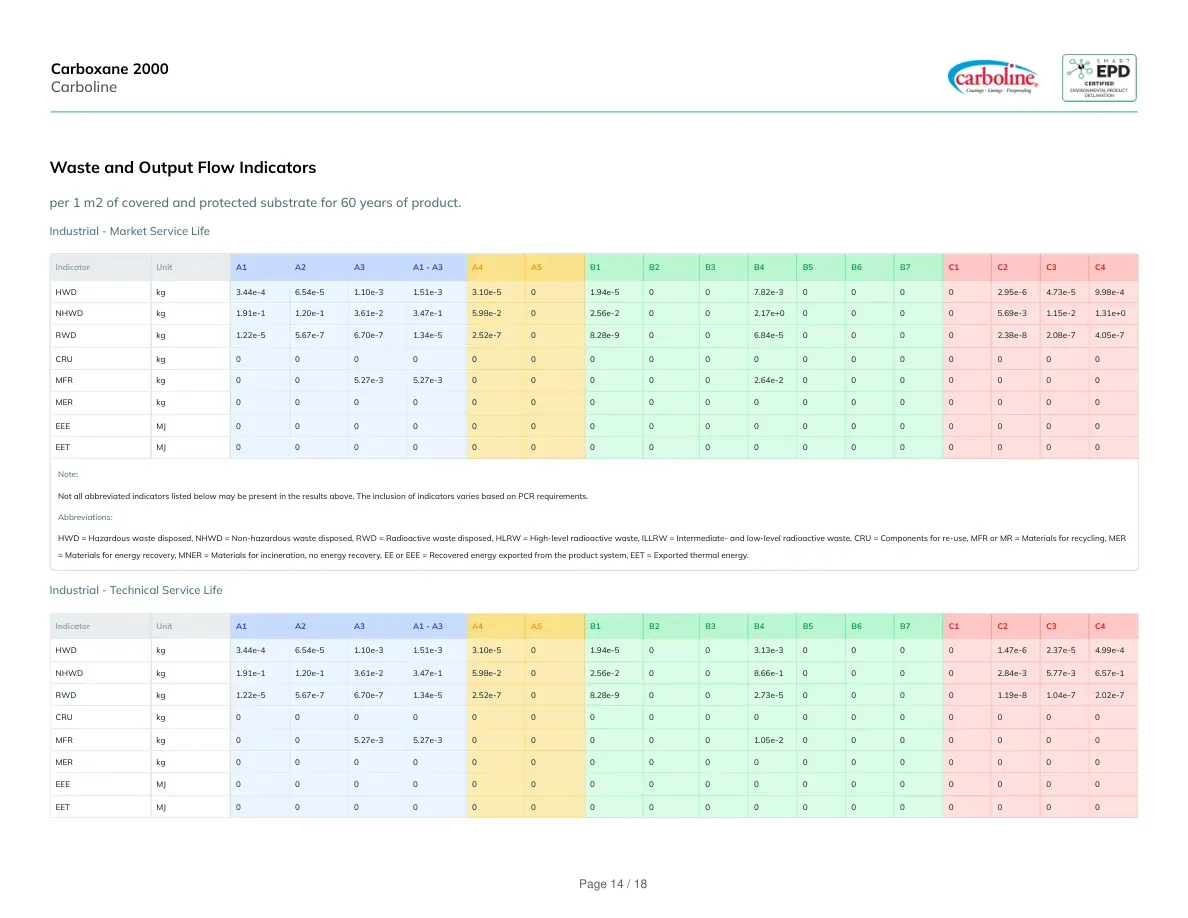
Waste and Output Flow Indicatorsper 1 m2 of covered and protected substrate for 60 years of product.Industrial - Market Service LifeIndicatorUnitA1A2A3A1 - A3A4A5B1B2B3B4B5B6B7C1C2C3C4HWDkg3.44e-46.54e-51.10e-31.51e-33.10e-501.94e-5007.82e-300002.95e-64.73e-59.98e-4NHWDkg1.91e-11.20e-13.61e-23.47e-15.98e-202.56e-2002.17e+000005.69e-31.15e-21.31e+0RWDkg1.22e-55.67e-76.70e-71.34e-52.52e-708.28e-9006.84e-500002.38e-82.08e-74.05e-7CRUkg00000000000000000MFRkg005.27e-35.27e-3000002.64e-20000000MERkg00000000000000000EEEMJ00000000000000000EETMJ00000000000000000Note:Not all abbreviated indicators listed below may be present in the results above. The inclusion of indicators varies based on PCR requirements.Abbreviations:HWD = Hazardous waste disposed, NHWD = Non-hazardous waste disposed, RWD = Radioactive waste disposed, HLRW = High-level radioactive waste, ILLRW = Intermediate- and low-level radioactive waste, CRU = Components for re-use, MFR or MR = Materials for recycling, MER= Materials for energy recovery, MNER = Materials for incineration, no energy recovery, EE or EEE = Recovered energy exported from the product system, EET = Exported thermal energy.Industrial - Technical Service LifeIndicatorUnitA1A2A3A1 - A3A4A5B1B2B3B4B5B6B7C1C2C3C4HWDkg3.44e-46.54e-51.10e-31.51e-33.10e-501.94e-5003.13e-300001.47e-62.37e-54.99e-4NHWDkg1.91e-11.20e-13.61e-23.47e-15.98e-202.56e-2008.66e-100002.84e-35.77e-36.57e-1RWDkg1.22e-55.67e-76.70e-71.34e-52.52e-708.28e-9002.73e-500001.19e-81.04e-72.02e-7CRUkg00000000000000000MFRkg005.27e-35.27e-3000001.05e-20000000MERkg00000000000000000EEEMJ00000000000000000EETMJ00000000000000000Carboxane 2000CarbolinePage 14 / 18
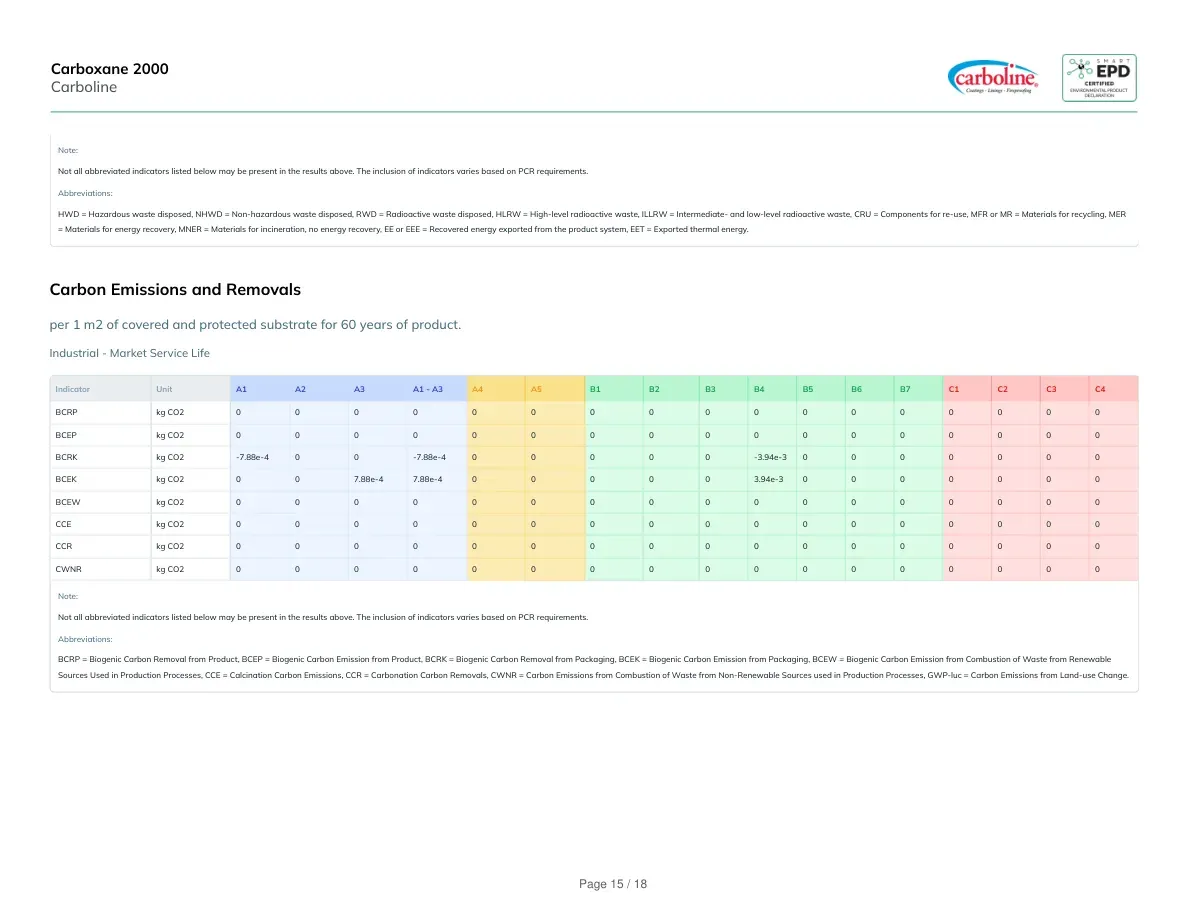
Note:Not all abbreviated indicators listed below may be present in the results above. The inclusion of indicators varies based on PCR requirements.Abbreviations:HWD = Hazardous waste disposed, NHWD = Non-hazardous waste disposed, RWD = Radioactive waste disposed, HLRW = High-level radioactive waste, ILLRW = Intermediate- and low-level radioactive waste, CRU = Components for re-use, MFR or MR = Materials for recycling, MER= Materials for energy recovery, MNER = Materials for incineration, no energy recovery, EE or EEE = Recovered energy exported from the product system, EET = Exported thermal energy.Carbon Emissions and Removalsper 1 m2 of covered and protected substrate for 60 years of product.Industrial - Market Service LifeIndicatorUnitA1A2A3A1 - A3A4A5B1B2B3B4B5B6B7C1C2C3C4BCRPkg CO200000000000000000BCEPkg CO200000000000000000BCRKkg CO2-7.88e-400-7.88e-400000-3.94e-30000000BCEKkg CO2007.88e-47.88e-4000003.94e-30000000BCEWkg CO200000000000000000CCEkg CO200000000000000000CCRkg CO200000000000000000CWNRkg CO200000000000000000Note:Not all abbreviated indicators listed below may be present in the results above. The inclusion of indicators varies based on PCR requirements.Abbreviations:BCRP = Biogenic Carbon Removal from Product, BCEP = Biogenic Carbon Emission from Product, BCRK = Biogenic Carbon Removal from Packaging, BCEK = Biogenic Carbon Emission from Packaging, BCEW = Biogenic Carbon Emission from Combustion of Waste from RenewableSources Used in Production Processes, CCE = Calcination Carbon Emissions, CCR = Carbonation Carbon Removals, CWNR = Carbon Emissions from Combustion of Waste from Non-Renewable Sources used in Production Processes, GWP-luc = Carbon Emissions from Land-use Change.Carboxane 2000CarbolinePage 15 / 18
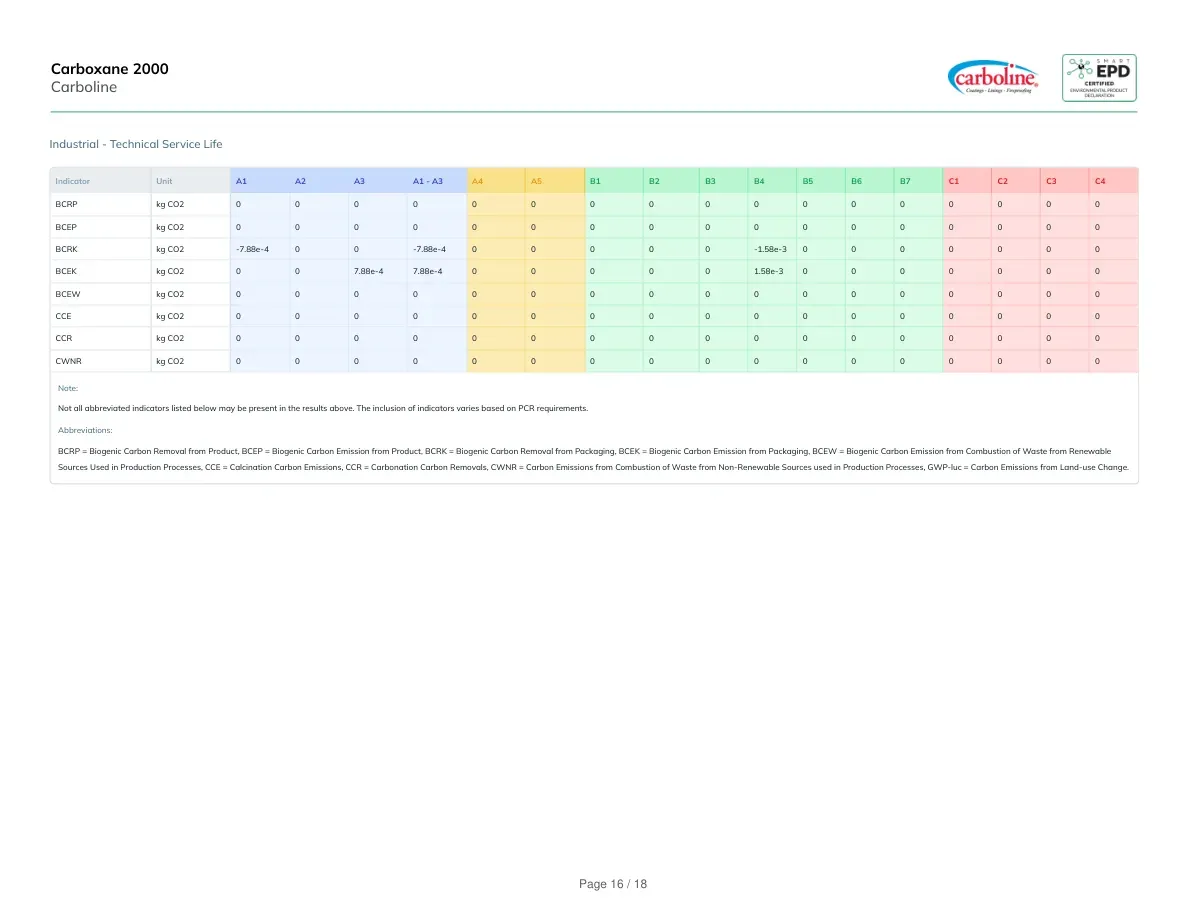
Industrial - Technical Service LifeIndicatorUnitA1A2A3A1 - A3A4A5B1B2B3B4B5B6B7C1C2C3C4BCRPkg CO200000000000000000BCEPkg CO200000000000000000BCRKkg CO2-7.88e-400-7.88e-400000-1.58e-30000000BCEKkg CO2007.88e-47.88e-4000001.58e-30000000BCEWkg CO200000000000000000CCEkg CO200000000000000000CCRkg CO200000000000000000CWNRkg CO200000000000000000Note:Not all abbreviated indicators listed below may be present in the results above. The inclusion of indicators varies based on PCR requirements.Abbreviations:BCRP = Biogenic Carbon Removal from Product, BCEP = Biogenic Carbon Emission from Product, BCRK = Biogenic Carbon Removal from Packaging, BCEK = Biogenic Carbon Emission from Packaging, BCEW = Biogenic Carbon Emission from Combustion of Waste from RenewableSources Used in Production Processes, CCE = Calcination Carbon Emissions, CCR = Carbonation Carbon Removals, CWNR = Carbon Emissions from Combustion of Waste from Non-Renewable Sources used in Production Processes, GWP-luc = Carbon Emissions from Land-use Change.Carboxane 2000CarbolinePage 16 / 18
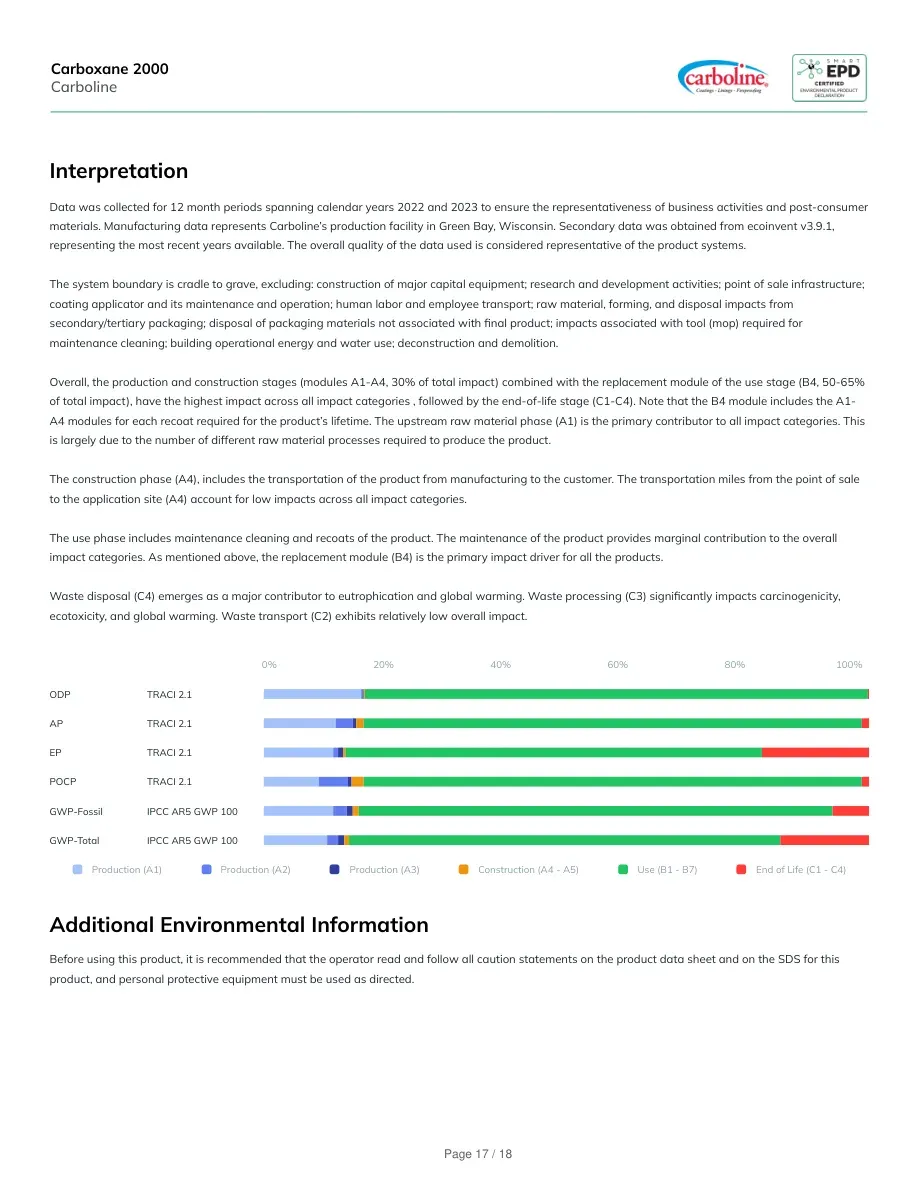
InterpretationData was collected for 12 month periods spanning calendar years 2022 and 2023 to ensure the representativeness of business activities and post-consumermaterials. Manufacturing data represents Carboline’s production facility in Green Bay, Wisconsin. Secondary data was obtained from ecoinvent v3.9.1,representing the most recent years available. The overall quality of the data used is considered representative of the product systems.The system boundary is cradle to grave, excluding: construction of major capital equipment; research and development activities; point of sale infrastructure;coating applicator and its maintenance and operation; human labor and employee transport; raw material, forming, and disposal impacts fromsecondary/tertiary packaging; disposal of packaging materials not associated with final product; impacts associated with tool (mop) required formaintenance cleaning; building operational energy and water use; deconstruction and demolition.Overall, the production and construction stages (modules A1-A4, 30% of total impact) combined with the replacement module of the use stage (B4, 50-65%of total impact), have the highest impact across all impact categories , followed by the end-of-life stage (C1-C4). Note that the B4 module includes the A1-A4 modules for each recoat required for the product’s lifetime. The upstream raw material phase (A1) is the primary contributor to all impact categories. Thisis largely due to the number of different raw material processes required to produce the product.The construction phase (A4), includes the transportation of the product from manufacturing to the customer. The transportation miles from the point of saleto the application site (A4) account for low impacts across all impact categories.The use phase includes maintenance cleaning and recoats of the product. The maintenance of the product provides marginal contribution to the overallimpact categories. As mentioned above, the replacement module (B4) is the primary impact driver for all the products.Waste disposal (C4) emerges as a major contributor to eutrophication and global warming. Waste processing (C3) significantly impacts carcinogenicity,ecotoxicity, and global warming. Waste transport (C2) exhibits relatively low overall impact.0%20%40%60%80%100%ODPTRACI 2.1APTRACI 2.1EPTRACI 2.1POCPTRACI 2.1GWP-FossilIPCC AR5 GWP 100GWP-TotalIPCC AR5 GWP 100Production (A1)Production (A2)Production (A3)Construction (A4 - A5)Use (B1 - B7)End of Life (C1 - C4)Additional Environmental InformationBefore using this product, it is recommended that the operator read and follow all caution statements on the product data sheet and on the SDS for this product, and personal protective equipment must be used as directed.Carboxane 2000CarbolinePage 17 / 18
References[1] ISO 14040:2006/Amd 1:2020, “Environmental management - Life cycle assessment - Principles and framework”.[2] ISO 14044:2006/Amd 1:2017/Amd 2:2020, “Environmental management - Life cycle assessment - Requirements and guidelines”.[3] ISO 21930:2017, “Sustainability in buildings and civil engineering works - Core rules for environmental product declarations of construction products andservices”.[4] NSF International, Product Category Rules for Environmental Product Declarations for Architectural Coatings, June 2015.[5] ISO 14025:2006, “Environmental labels and declarations - Type III environmental declarations - Principles and procedures”.[6] Bare, J. 2014. Tool for the Reduction and Assessment of Chemical and Other Environmental Impacts (TRACI) TRACI version 2.1 User’s Guide. US EPAOffice of Research and Development, Washington, DC, EPA/600/R-12/554, http://nepis.epa.gov/Adobe/PDF/P100HN53.pdf[7] IPCC, 2013: Climate Change 2013: The Physical Science Basis. Contribution of Working Group I to the Fifth Assessment Report of the IntergovernmentalPanel on Climate Change [Stocker, T.F., D. Qin, G.-K. Plattner, M. Tignor, S.K. Allen, J. Boschung, A. Nauels, Y. Xia, V. Bex and P.M. Midgley (eds.)]. CambridgeUniversity Press, Cambridge, United Kingdom and New York, NY, USA, 1535 pp. https://www.ipcc.ch/report/ar5/wg1/[8] ecoinvent v3.9.1, December 2022, https://ecoinvent.org/the-ecoinvent-database/data-releases/ecoinvent-3-9-1/[9] US Environmental Protection Agency Waste Reduction Model (WARM) v15, September 2022, https://www.epa.gov/warm/versions-waste-reduction-model-warm#15[10] Ryberg, M., M. Vieira, M. Zgola, et al. Updated US and Canadian Normalization Factors for TRACI 2.1. CLEAN TECHNOLOGIES ENVIRONMENTALPOLICY. Springer, New York, NY, 16(2):329-339 (2014). http://dx.doi.org/10.1007/s10098-013-0629-z[11] Weidema B. P., C. Bauer, R. Hischier, et al. Overview and methodology. Data quality guideline for the ecoinvent database version 3. Ecoinvent Report1(v3), St. Gallen: The ecoinvent Centre (2013). https://ecoinvent.org/wp-content/uploads/2021/09/dataqualityguideline_ecoinvent_3_20130506.pdf[12] Facts and figures about materials, waste and recycling (2018). https://www.epa.gov/facts-and-figures-about-materials-waste-and-recycling[13] Carboline Internal Report, Life Cycle Assessment of Carboquick 200 Coating, September 2023[14] Carboline Internal Report, Amendment to Life Cycle Assessment of Carboquick 200 Coating for Sixteen Additional Coatings, March 2024Carboxane 2000CarbolinePage 18 / 18
